Entering data in STAT mode: the statistics editor and the frequency column in Scientific calculator plus 991 for Android
In STAT mode the statistics editor is a table: one x column for single-variable data, x and y columns for paired data, and a Frequency column for values that repeat. Type a value and press =; the value goes into the cell and the selection moves down one row, so a whole column goes in without the arrow keys. The data stays in the editor after you leave STAT mode, and is saved when the app closes.
- Columns
- x, or x and y, then Frequency
- Commit a cell
- =, which moves down one row
- Committing a row
- a blank x or y becomes 0, a blank Frequency 1
- Kept
- after leaving STAT, and when the app closes
Every statistic in STAT mode is worked out from the numbers in one table, the statistics editor. This page covers getting numbers into it, correcting them and deleting them: the columns, the key that commits a cell, the Frequency column for values that repeat, and the ways to insert and delete rows.
Opening the editor
How to open the statistics editor
-
Press MODE and choose STAT/DISTR.
-
Press SHIFT 1 STAT and open the DATA tab. The menu reopens on whichever tab you used last.
-
Choose a calculation type: 1-VAR for a single column, or one of the seven regression types for paired data. The editor opens, laid out for that type.
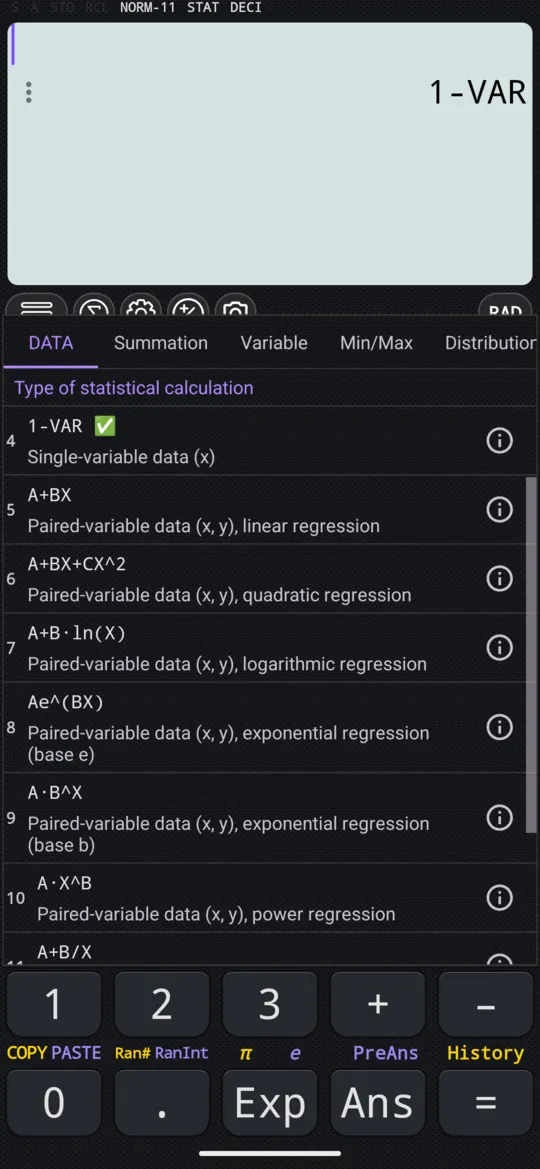
To reopen the editor without changing the type, choose Data on the DATA tab instead; the selection goes back to the first cell. Single-variable and paired data are kept apart, so choosing another type loses neither.
The columns
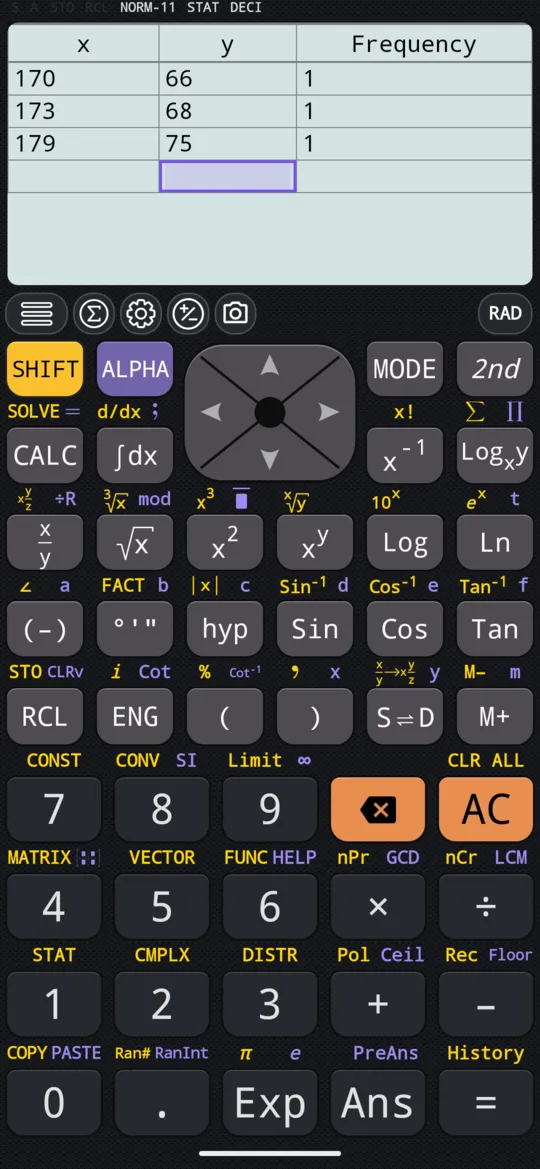
The editor has one column for 1-VAR, and two, x and y, for a paired type. A Frequency column comes after them, for the number of times each row counts. Two rows of paired data, each counted once, look like this:
| x | y | Frequency |
|---|---|---|
| 170 | 66 | 1 |
| 173 | 68 | 1 |
Entering a column
Type a value and press =: the value goes into the cell and the selection moves down one row in the same column. Nothing goes into a cell until you press it. A fresh row is added when the one you filled was the last, so a column goes in straight down, value = value =, without the arrow keys.
- A cell takes an expression as well as a number: entering 2+3 stores 5.
- Committing a row whose other cells are still blank fills them in. A blank x or y becomes 0, and a blank Frequency becomes 1.
- The blank row left under the last value does no harm. A row with a cell still blank is dropped before any calculation runs.
Example: three pairs
The manual fits a logarithmic curve to three pairs, (170, 66), (173, 68) and (179, 75). Entering them is the same for any paired type.
How to enter paired data
-
Press SHIFT 1 STAT and choose A+B·ln(X) on the DATA tab. The editor opens with an x and a y column.
-
Fill the x column, pressing = after each value: 170 = 173 = 179 =.
-
Go to the top of the y column with down right and fill it the same way: 66 = 68 = 75 =. From the blank row at the bottom, down wraps round to the first row.
-
Press SHIFT 1 STAT again and choose Regression calculation on the DATA tab to fit the curve.
| x | y |
|---|---|
| 170 | 66 |
| 173 | 68 |
| 179 | 75 |
The regression screen's first row is the model with its letters unfilled, and the rows below are the fitted values:
in REGRESSION
out y = a + bLn(x), a = -852.16277461319, b = 178.68979688248, r = 0.99198632129
So the curve is y = −852.16277461319 + 178.68979688248·ln(x), and r close to 1 says it follows the three points closely. Regression and correlation covers the models and what r means.
The Frequency column
A value that occurs several times goes in once, with its count in the Frequency column. The nine values 1, 2, 2, 3, 3, 3, 4, 4 and 5 take five rows:
| x | Frequency |
|---|---|
| 1 | 1 |
| 2 | 2 |
| 3 | 3 |
| 4 | 2 |
| 5 | 1 |
To enter it, fill the x column as before: each row's Frequency fills in as 1 when the row is committed. Then go to the top of the Frequency column with down right and type each count over its 1, pressing = after each.
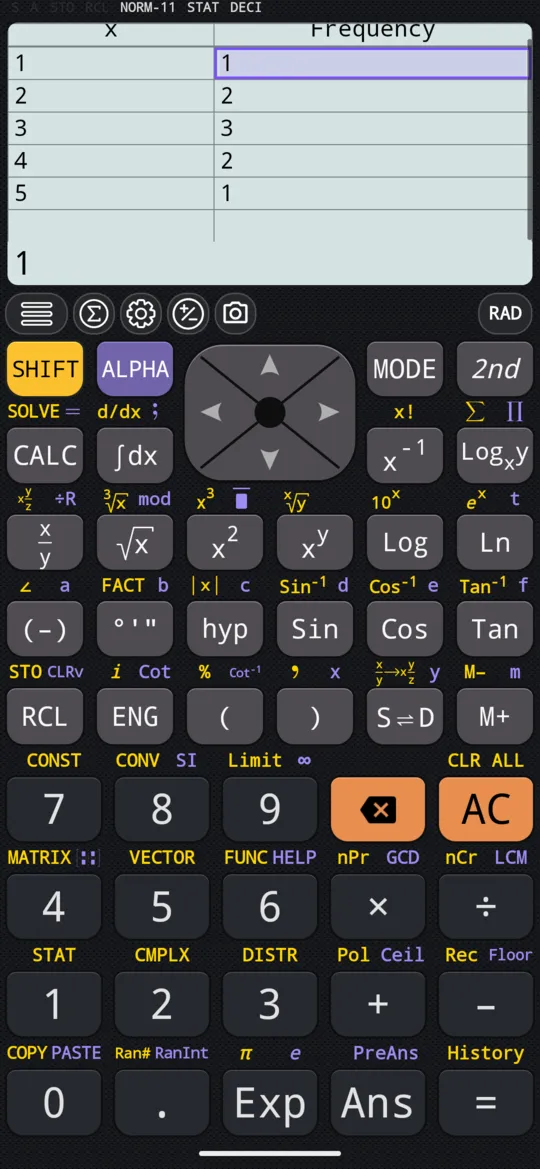
Every statistic then counts each row as many times as its frequency says: the mean of these five rows is 3, the mean of all nine values, as on mean and standard deviation. The count n is the total of the Frequency column, not the number of rows. A frequency need not be a whole number, so neither need n.
When every row counts once, you can turn the column off: Frequency column, under Settings → Calculation → STAT/DISTR.
Moving round and editing
- The arrow keys, left right up down , move from cell to cell. The selection wraps round at the edges of the table.
- Arrowing onto a cell shows its value, and the next key you type replaces it. Tap the cell instead to edit what is already there.
- Press DEL to delete the row the selection is on. While you are typing into a cell, it deletes a character instead.
- Press SHIFT AC to delete every row.
- Press AC to leave the editor for the calculation screen, keeping the data. Halfway through typing a cell, the first press clears what you typed and the second leaves.
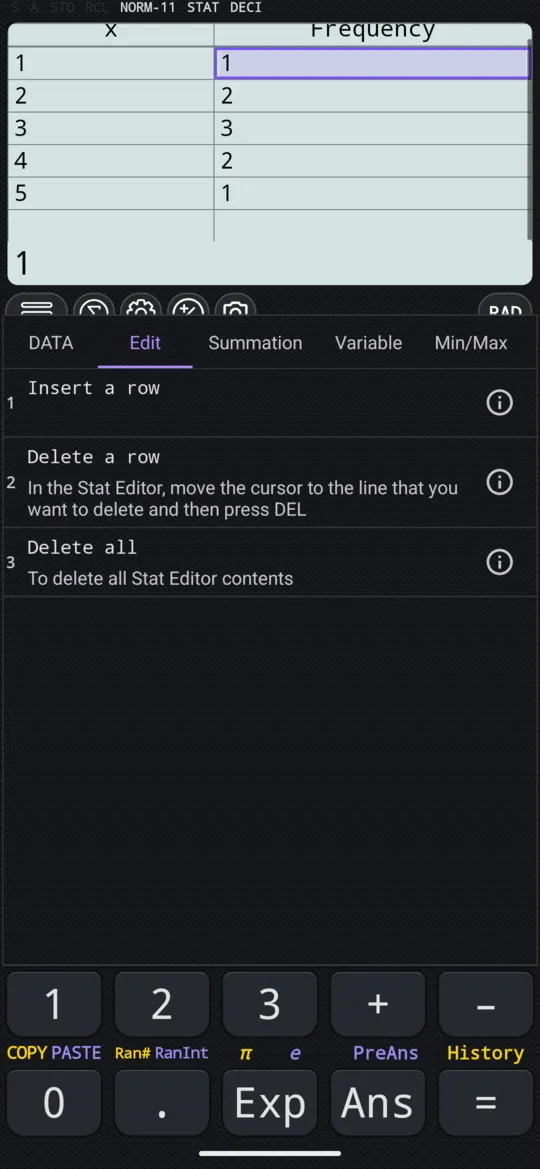
The Edit tab of the STAT menu, which appears only while the editor is open, has the two deletions by name, Delete a row and Delete all, and one job the keys cannot do: Insert a row. Inserting a row has no key of its own, so this tab is the only way to do it.
When the data is rejected
| Message | Why |
|---|---|
| Input is empty | = was pressed on a cell with nothing typed in it |
| Statistical data is empty | A statistic was asked for before any data was entered; the dialog offers to open the editor |
| Math Error: Wrong data type | A cell holds something that is not a real number, or a frequency is negative |
| Math Error: Data is empty | Every frequency is 0, so nothing is left to count |
At a glance
| Keys | In the editor |
|---|---|
| = | Commits the cell and moves down one row |
| left right up down | Move between cells, wrapping round at the edges |
| DEL | Deletes the row, or a character while typing |
| SHIFT AC | Deletes every row |
| AC | Leaves the editor, keeping the data |
| SHIFT 1 STAT, DATA, Data | Reopens the editor on its first cell |
Questions
How do I enter data with frequencies?
Put each different value in the x column once, and the number of times it occurs beside it in the Frequency column. The nine values 1, 2, 2, 3, 3, 3, 4, 4 and 5 go in as five rows, with frequencies 1, 2, 3, 2 and 1. The count n is then the total of the Frequency column, 9, not the number of rows.
How do I delete a row, or all of the data?
In the editor, DEL deletes the row the selection is on, and SHIFT then AC deletes every row. With the editor open, the Edit tab of the STAT menu does the same by name, and also inserts a row, which has no key of its own.
Can I type a calculation into a cell?
Yes. A cell takes an expression as well as a number: entering 2+3 stores 5. Nothing is written until you press =.
Is my data saved when I close the app?
Yes. Entered data survives leaving STAT mode and is saved when the app closes. Single-variable and paired data are kept apart, so choosing another calculation type does not lose either.
Related pages
- Statistics and probability which tool for which job, and what each page of the chapter covers
- Mean, standard deviation, variance and quartiles from your data x̄, σx and sx, variance, n, quartiles and the median
- Regression the line of best fit, the six curves, r, ŷ and x̂
Written from the calculator's own manual and from the app itself, version 7.6.0; every figure is one the manual shows or a capture of the app proves. Last revised on 29 September 2026.
Bug reports and feature requests go to kimcuc@samatica.com — a person reads it.