Regression: fit a line or curve, read r and predict from it in Scientific calculator plus 991 for Android
In STAT mode, choose a regression type on the DATA tab of SHIFT 1 (STAT): A+BX for a straight line, or one of six curves. Enter the x and y columns, then choose Regression calculation: the screen gives the model, its coefficients a and b, and the correlation coefficient r. The Regression tab has each of them on its own, with ŷ to predict y from a value of x and x̂ to find x from a value of y.
- Models
- linear, quadratic and five other curves
- Fit
- DATA ► Regression calculation: a, b, r
- Predict
- value, then ŷ (or x̂), then =
- Quadratic
- adds c, and gives R² in place of r
Regression finds the line or curve that best follows a set of paired points, and correlation says how closely it follows them. On the calculator both come from STAT mode: you pick the shape of the model, enter the pairs, and the fitted numbers come back on one screen, ready to use for a prediction.
Fit a straight line
How to find the line of best fit
-
Press MODE and choose STAT/DISTR.
-
Press SHIFT 1 STAT and choose A+BX on the DATA tab. The editor opens with an x and a y column.
-
Enter the x values down the first column and the y values down the second, pressing = after each, as on the statistics editor.
-
Press SHIFT 1 STAT and choose Regression calculation on the DATA tab.
For the pairs (170, 66), (173, 68) and (179, 75):
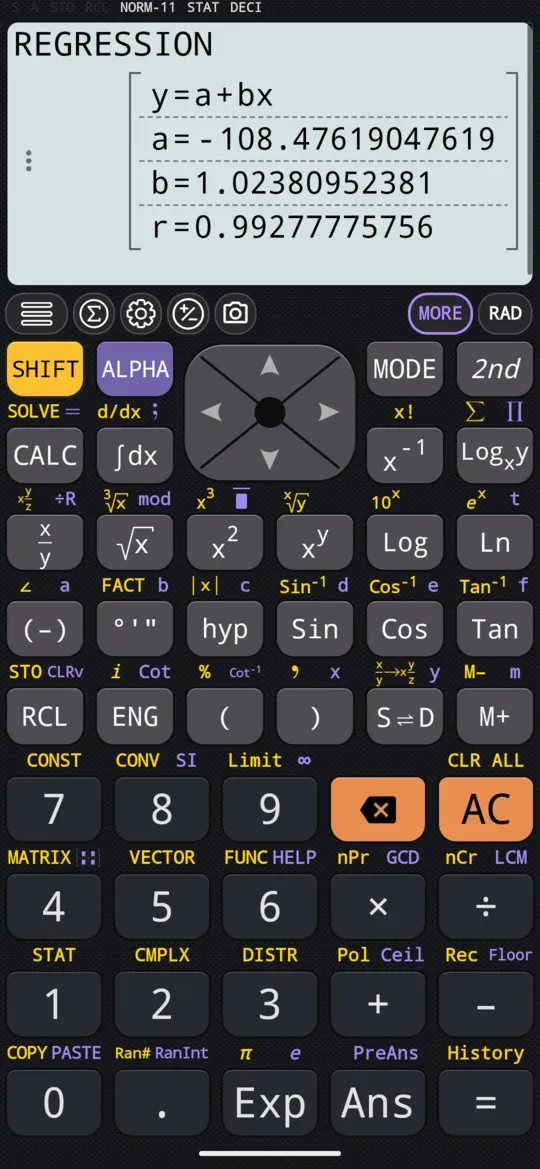
in REGRESSION
out y = a + bx, a = -108.47619047619, b = 1.02380952381, r = 0.99277775756
The first row is the model with its letters unfilled, and the rows below are the fitted values. So the line is y = −108.47619047619 + 1.02380952381x, and r close to 1 says the three points lie close to it.
Seven models
A+BX fits a straight line; the other six fit curves. Choose the type on the DATA tab before entering the data. Switching later from one paired type to another keeps the x and y columns and simply refits them, so one set of data can be tried against several models.
| Type | Model |
|---|---|
| A+BX | y = a + bx, linear |
| A+BX+CX^2 | y = a + bx + cx², quadratic |
| A+B·ln(X) | y = a + b·ln(x), logarithmic |
| Ae^(BX) | y = a·e^(bx), e exponential |
| A·B^X | y = a·b^x, ab exponential |
| A·X^B | y = a·x^b, power |
| A+B/X | y = a + b/x, inverse |
A curve, and one coefficient at a time
The manual fits a logarithmic curve to four pairs:
| x | y |
|---|---|
| 20 | 3150 |
| 110 | 7310 |
| 200 | 8800 |
| 290 | 9310 |
With A+B·ln(X) chosen and the pairs entered, one coefficient can be read on its own: press SHIFT 1 STAT, go to the Regression tab, choose a and press =.
in a
out -3857.98441327089
Choosing Regression calculation on the DATA tab gives all of them at once:
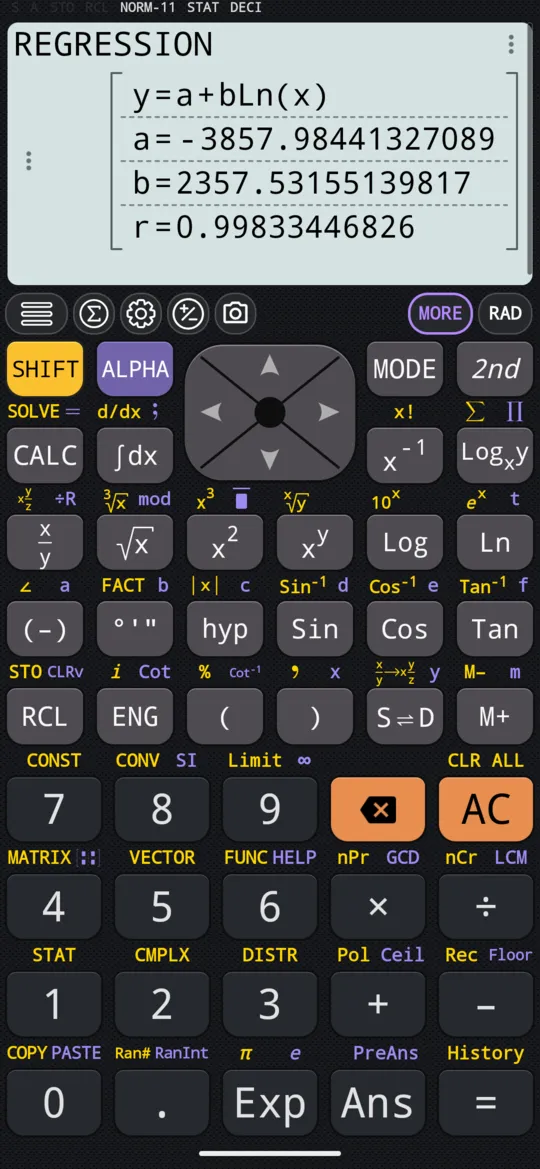
in REGRESSION
out y = a + bLn(x), a = -3857.98441327089, b = 2357.53155139817, r = 0.99833446826
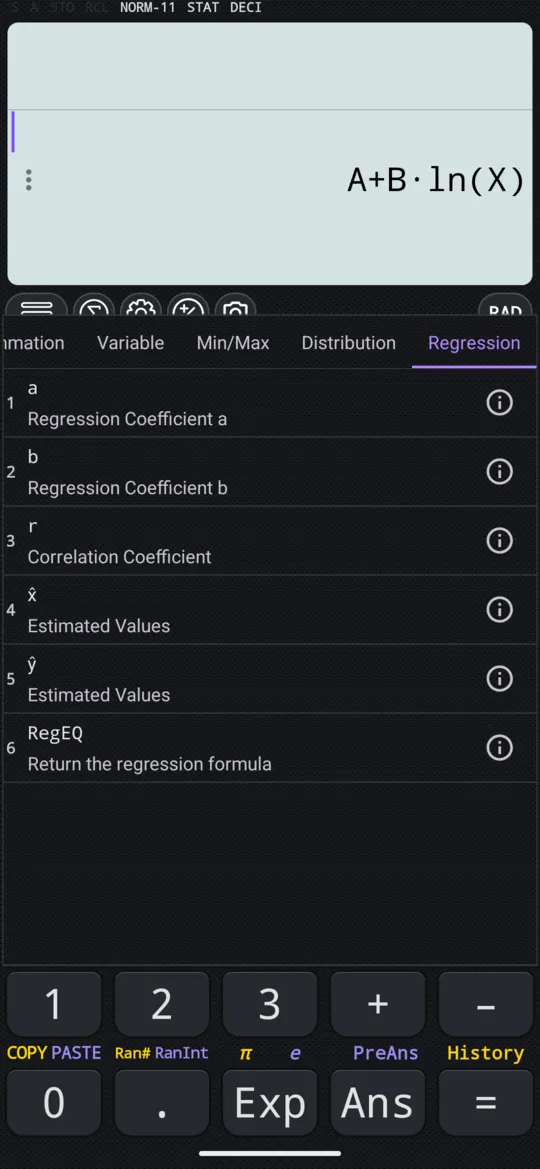
The Regression tab holds:
- a, b: the fitted coefficients of the model.
- r: the correlation coefficient.
- x̂, ŷ: the x for a value of y, and the y for a value of x, read from the model (see predict y, or find x below).
- RegEQ: the whole fitted equation, with the numbers filled in.
What r measures
r says how closely the model follows the points: the nearer it is to 1 or to −1, the closer the fit.
The quadratic type is the exception: it adds a third coefficient, c, and reports R², the coefficient of determination, in place of r.
Predict y, or find x
Once a model is fitted it can be read in either direction. ŷ turns a value of x into the y the model predicts, and x̂ turns a value of y back into the x that gives it. Both use the regression type that is chosen and the data in the editor, so choose the type and enter the data first.
Both go after the value, not before it: the estimate of y at x = 160 is typed 160 ŷ, not ŷ(160).
How to predict y from x
-
Choose the regression type and enter the data (here, A+B·ln(X) with the four pairs above), then leave the editor with AC.
-
Type the value of x: 160.
-
Press SHIFT 1 STAT, choose ŷ on the Regression tab, and press =.
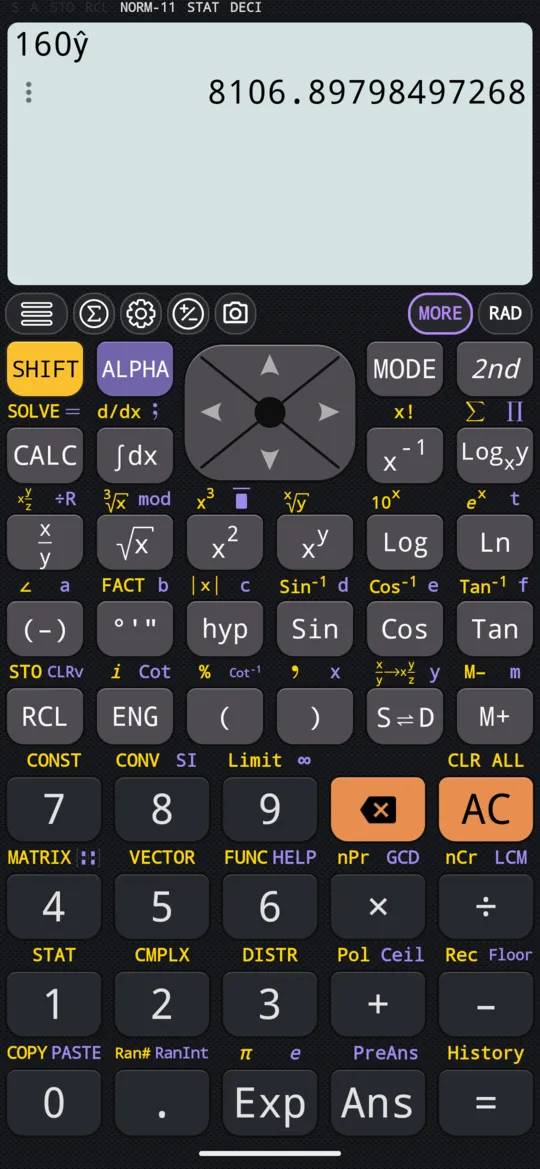
For the logarithmic fit above, the answer is 8106.89798497268. The model, as RegEQ writes it, was y = −3857.9844132709 + 2357.53155139817·ln(x), and ln(160) is about 5.0751738, which is where the estimate comes from.
To go the other way, type a value of y and choose x̂ instead of ŷ. A parabola reaches most heights twice, so the quadratic type offers x̂1 and x̂2 in place of x̂.
The regression graph
Choosing Regression graph on the DATA tab draws the entered points and the fitted line or curve through them, for any of the seven paired types. The manual's example fits a quadratic to six points: (1, 3), (2, 4), (6, 12), (7, 16), (12, 47) and (33, 300).
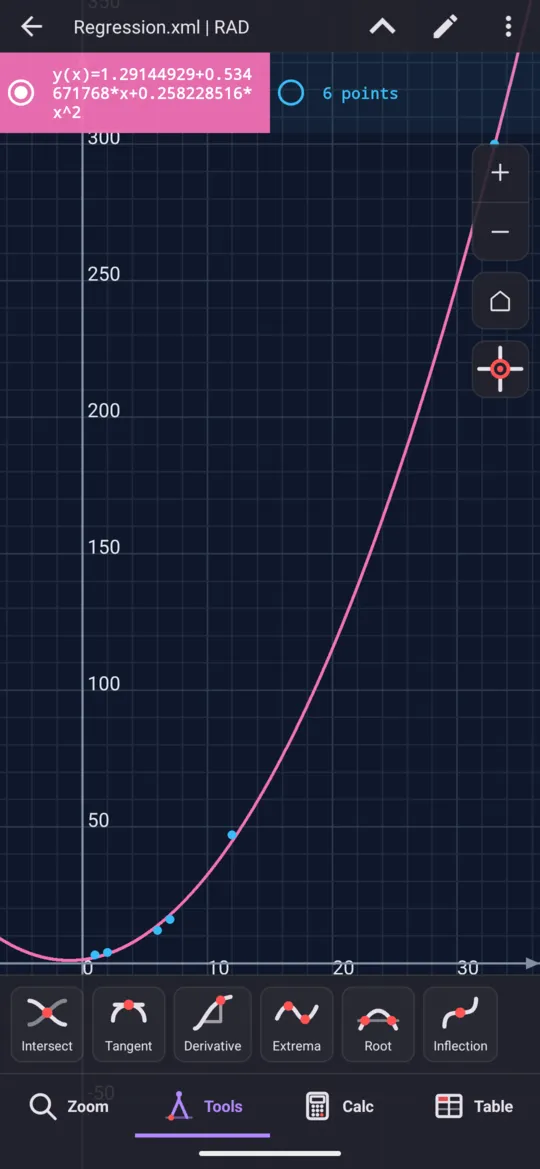
To plot a function of your own, or make a table of values from it, see graphs and tables.
At a glance
| To get | Choose |
|---|---|
| The whole fit | SHIFT 1 STAT, DATA, Regression calculation |
| One coefficient | Regression tab, then a, b or c, and = |
| The correlation coefficient | Regression tab, r (R² for the quadratic), = |
| A predicted y | The x value, then Regression tab, ŷ, = |
| The x for a given y | The y value, then Regression tab, x̂, = |
| The fitted equation | Regression tab, RegEQ, = |
| The points and the fit | DATA, Regression graph |
Questions
How do I find the line of best fit?
Press MODE and choose STAT/DISTR, choose A+BX on the DATA tab of SHIFT 1 (STAT), and enter the x values down one column and the y values down the other. Then choose Regression calculation on the DATA tab. For (170, 66), (173, 68) and (179, 75) the line is y = a + bx with a = −108.47619047619 and b = 1.02380952381.
What does r tell me?
r is the correlation coefficient: the closer it is to 1 (or to −1), the more closely the model follows the points. It measures the model you chose, not the raw columns: for a logarithmic fit it is the correlation of ln(x) with y. The quadratic type reports R², the coefficient of determination, instead.
How do I predict y for a new x?
Fit the model first, then type the x value, choose ŷ on the Regression tab and press =. ŷ comes after the value, not before it: the estimate at x = 160 is typed 160 ŷ. x̂ does the reverse, from a value of y to the x that gives it.
Can it fit a curve instead of a line?
Yes: quadratic (y = a + bx + cx²), logarithmic (y = a + b·ln(x)), two exponential forms (y = a·e^(bx) and y = a·b^x), power (y = a·x^b) and inverse (y = a + b/x). Switching type keeps the same x and y columns and refits them, so you can compare models on one set of data.
Related pages
- Entering data in STAT mode the editor, the Frequency column, inserting and deleting rows
- Mean, standard deviation, variance and quartiles from your data x̄, σx and sx, variance, n, quartiles and the median
- Statistics and probability which tool for which job, and what each page of the chapter covers
Written from the calculator's own manual and from the app itself, version 7.6.0; every figure is one the manual shows or a capture of the app proves. Last revised on 29 September 2026.
Bug reports and feature requests go to kimcuc@samatica.com — a person reads it.