Student-t, chi-square and F distributions: tcdf, invT, χ²cdf and Fcdf in Scientific calculator plus 991 for Android
The distribution menu, SHIFT 3 (DISTR), has seven functions for the distributions that take degrees of freedom instead of a mean and a standard deviation. tcdf, χ²cdf and Fcdf give the probability between two bounds; invT runs tcdf backwards, from an area to the t-value a printed table would give; tpdf, χ²pdf and Fpdf give the height of each curve. invT(0.95, 24) is 1.71088207991. Switch to numeric calculation first, with S⇌D, or the answer comes back as an exact expression.
- Student-t
- tcdf, invT, tpdf; df greater than 0
- Chi-square
- χ²cdf, χ²pdf; df a whole number greater than 0
- F
- Fcdf, Fpdf; two df, numerator and denominator
- Menu
- SHIFT 3 (DISTR)
The Student-t, chi-square and F distributions are the ones behind t-tests, chi-square tests and the comparison of two variances. Where the normal distribution takes a mean and a standard deviation, these take degrees of freedom. On the calculator each has a cumulative function for a probability and a density function for the height of its curve, and the t distribution has an inverse as well.
Before you start
All seven are on the distribution menu, SHIFT 3 DISTR; type part of a name in its search box to narrow the list, as on the normal distribution. Each entry shows its arguments in order. The chi-square names begin with χ², so choose them from the menu.
- df is the degrees of freedom. For Student-t it must be greater than 0; for chi-square it must be a whole number greater than 0.
- The F functions take two degrees of freedom, a numerator df and a denominator df, because the F distribution compares two variances. Each must be a whole number greater than 0.
- A chi-square or F value is never negative, so a probability below a value starts its interval at 0.
Student-t
invT(area, df) runs tcdf backwards: given the area to the left of a point, it returns the t-value that point sits at. This is the number a printed t-table would give.
How to find a t-value from an area
-
If DECI is not on the status line, press S⇌D to switch to numeric calculation.
-
Press SHIFT 3 DISTR and choose invT.
-
Type the area to the left, press SHIFT ) , for the comma, then type the degrees of freedom and press =.
The t-value with 95% of the area to its left, on 24 degrees of freedom:
in invT(0.95, 24)
out 1.71088207991
That is the value a t-table lists for 5% in one tail. For a two-sided 95% interval, put in 0.975 instead, leaving 2.5% in each tail.
tcdf(lowerbound, upperbound, df) gives the probability that a t value falls between the two bounds. Between −2 and 3 on 18 degrees of freedom:
in tcdf(-2, 3, 18)
out 0.9657465611
tpdf(x, df) gives the density: the height of the curve at x, not a probability. At x = 2.2 on 2 degrees of freedom:
in tpdf(2.2, 2)
out 0.05590051995
Chi-square
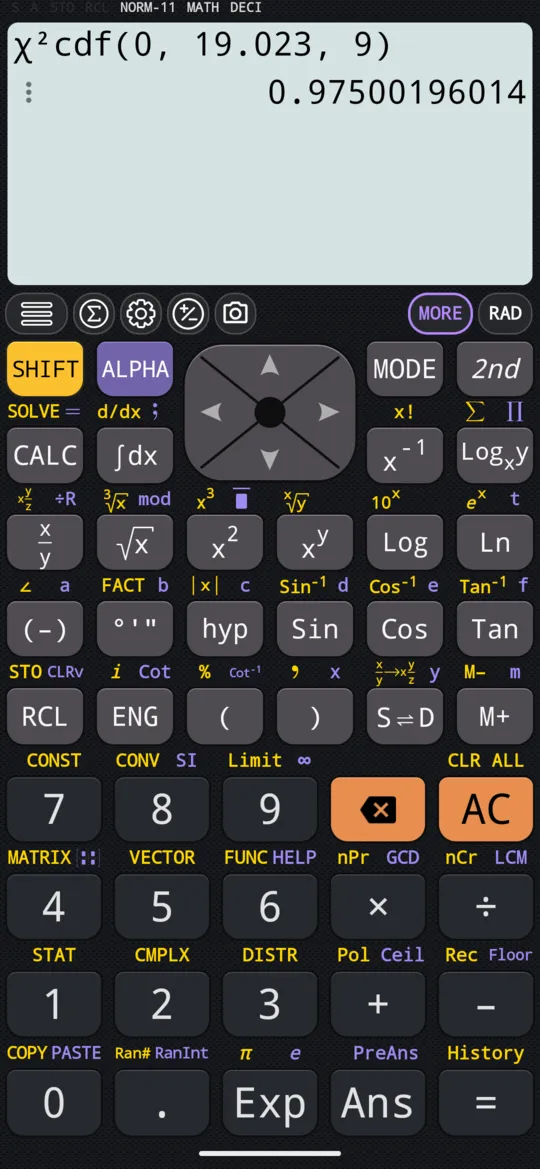
χ²cdf(lowerbound, upperbound, df) gives the probability that a chi-square value falls between the two bounds. The probability below 19.023 on 9 degrees of freedom:
in χ²cdf(0, 19.023, 9)
out 0.97500196014
So 19.023 is the 97.5% point of that distribution. The interval starts at 0 because a chi-square value is never negative.
χ²pdf(x, df) gives the height of the chi-square curve at x. At x = 2 on 9 degrees of freedom:
in χ²pdf(2, 9)
out 0.01581361895
F
Fcdf(lowerbound, upperbound, numerator df, denominator df) gives the probability that an F value falls between the two bounds. The probability below 2.4523, with 24 and 19 degrees of freedom:
in Fcdf(0, 2.4523, 24, 19)
out 0.97499895769
So 2.4523 is the 97.5% point of that distribution.
Fpdf(x, numerator df, denominator df) gives the height of the F curve at x. At x = 2, with 24 and 19 degrees of freedom:
in Fpdf(2, 24, 19)
out 0.13436820209
At x = 5, with 4 and 3 degrees of freedom:
in Fpdf(5, 4, 3)
out 0.02671503274
pdf, cdf and inv
- A cdf function gives a probability: the area under the curve between two bounds.
- Here, a pdf function (tpdf, χ²pdf, Fpdf) gives the height of the curve at one value. It is not a probability.
- invT goes the other way from tcdf, from an area to a value, as invNorm does for the normal distribution.
At a glance
| What to use | Gives |
|---|---|
| SHIFT 3 DISTR | The distribution menu |
| invT(area, df) | The t-value with that area to its left |
| tcdf(lowerbound, upperbound, df) | A Student-t probability |
| tpdf(x, df) | The Student-t density at x |
| χ²cdf(lowerbound, upperbound, df) | A chi-square probability |
| χ²pdf(x, df) | The chi-square density at x |
| Fcdf(lowerbound, upperbound, numerator df, denominator df) | An F probability |
| Fpdf(x, numerator df, denominator df) | The F density at x |
| S⇌D | Numeric calculation, for a decimal answer |
Questions
How do I find a t critical value without a table?
Use invT(area, df) from the distribution menu, SHIFT 3 (DISTR). It returns the t-value with that area to its left, the number a printed t-table would give: invT(0.95, 24) is 1.71088207991, the value for 5% in one tail. If the calculator is in symbolic calculation, press S⇌D first to switch to numeric.
How do I work out a chi-square probability?
Choose χ²cdf(lowerbound, upperbound, df) from the distribution menu, SHIFT 3 (DISTR). A chi-square value is never negative, so a probability below a value starts at 0: χ²cdf(0, 19.023, 9) is 0.97500196014, which makes 19.023 the 97.5% point on 9 degrees of freedom.
Why does the F distribution need two degrees of freedom?
Because it compares two variances, each with degrees of freedom of its own: the numerator's first, then the denominator's. Fcdf(0, 2.4523, 24, 19) is 0.97499895769, so 2.4523 is the 97.5% point with 24 and 19 degrees of freedom.
Why do I get BetaRegularized instead of a number?
The calculator is in symbolic calculation, which keeps answers exact, and the exact t and F probabilities are written with the regularized beta function. Press S⇌D to switch to numeric calculation.
Related pages
- Normal distribution normalcdf, invNorm and normalpdf, and the one-sided trick
- Binomial, Poisson and geometric probabilities binompdf and binomcdf, Poisson, geometric, lists and the whole table
- Statistics and probability which tool for which job, and what each page of the chapter covers
Written from the calculator's own manual and from the app itself, version 7.6.0; every figure is one the manual shows or a capture of the app proves. Last revised on 29 September 2026.
Bug reports and feature requests go to kimcuc@samatica.com — a person reads it.