Mean, standard deviation, variance and quartiles from your data in Scientific calculator plus 991 for Android
In STAT mode, press SHIFT 1 (STAT), choose 1-VAR on the DATA tab and enter the numbers in the editor; then open the menu again and choose 1-variable calculation on the same tab. One screen gives all thirteen values: the mean x̄, the sums ∑x and ∑x², the population and sample variances and standard deviations (σ²x, σx, s²x, sx), the count n, and the five-number summary min(x), Q1, Med, Q3 and max(x). Each one can also be taken on its own, from the STAT menu's tabs.
- Mean
- x̄, on the Variable tab
- Standard deviation
- σx (population), sx (sample)
- Quartiles
- Q1, Med, Q3, on the Min/Max tab
- All at once
- DATA ► 1-variable calculation
The mean, the standard deviation and the median describe the same column of numbers in three ways, and STAT mode works them out together. Enter the data once, and one screen lists thirteen statistics; the STAT menu's tabs then give any one of them on its own, for use in a calculation.
Every statistic at once
How to find the mean and standard deviation
-
Press MODE and choose STAT/DISTR.
-
Press SHIFT 1 STAT and choose 1-VAR on the DATA tab. The editor opens with an x column and a Frequency column.
-
Type each value down the x column, pressing = after each. A value that repeats can go in once, with its count typed into the Frequency column; the statistics editor page shows how.
-
Press SHIFT 1 STAT again and choose 1-variable calculation on the DATA tab.
The manual's data is the nine values 1, 2, 2, 3, 3, 3, 4, 4 and 5, entered as five rows with the Frequency column carrying the repeats:
| x | Frequency |
|---|---|
| 1 | 1 |
| 2 | 2 |
| 3 | 3 |
| 4 | 2 |
| 5 | 1 |
in 1-VAR
out x̄ = 3, ∑x = 27, ∑x² = 93, σ²x = 1.33333333333, σx = 1.15470053838, s²x = 1.5, sx = 1.22474487139, n = 9, min(x) = 1, Q1 = 2, Med = 3, Q3 = 4, max(x) = 5
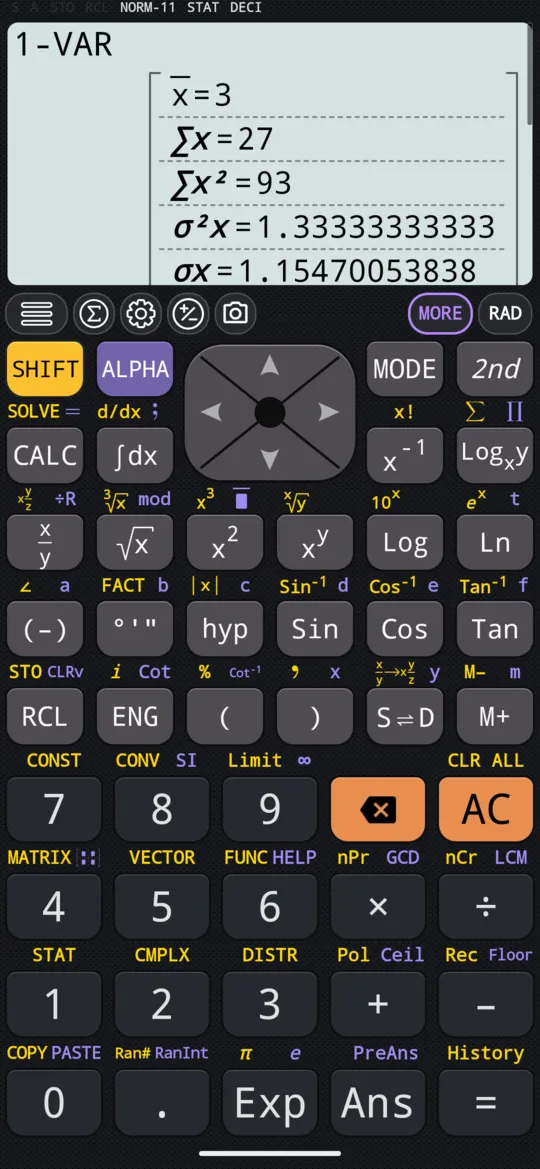
The screen is longer than the display: drag it up to see the rest.
Values are shown to up to eleven decimal places. Read from the top, the thirteen are:
| Row | What it is |
|---|---|
| x̄ | The mean |
| ∑x, ∑x² | The sum of the values, and the sum of their squares |
| σ²x, σx | The population variance and standard deviation |
| s²x, sx | The sample variance and standard deviation |
| n | The count: the total of the Frequency column |
| min(x), Q1, Med, Q3, max(x) | The five-number summary: the smallest value, the lower quartile, the median, the upper quartile and the largest value |
Population or sample
The calculator gives both standard deviations, and they differ in what the variance divides by: σ²x divides by n, s²x by n − 1. So s²x and sx come out larger, and the gap is widest when there are few values. Above, σ²x is 1.33333333333 and s²x is 1.5.
Which one you want depends on the data. If the numbers are the whole group you are describing, use σx, the population form. If they are a sample from a larger group, use sx, the sample form. A textbook that writes the standard deviation with n − 1 means sx.
A value that cannot be worked out is shown as Indeterminate rather than raising an error. With a single value (n = 1), s²x and sx are Indeterminate, since dividing by n − 1 divides by zero.
One statistic on its own
Every statistic is also a variable. Choose one from the STAT menu and it goes into the calculation you are typing, and = evaluates it, so you can read it alone or use it in a longer expression.
How to take the mean on its own
-
With the data in the editor, press SHIFT 1 STAT and go to the Variable tab.
-
Choose x̄, then press =.
in x̄
out 3
That is the mean of all nine values, though only five rows were typed: the Frequency column stands in for the repeats.
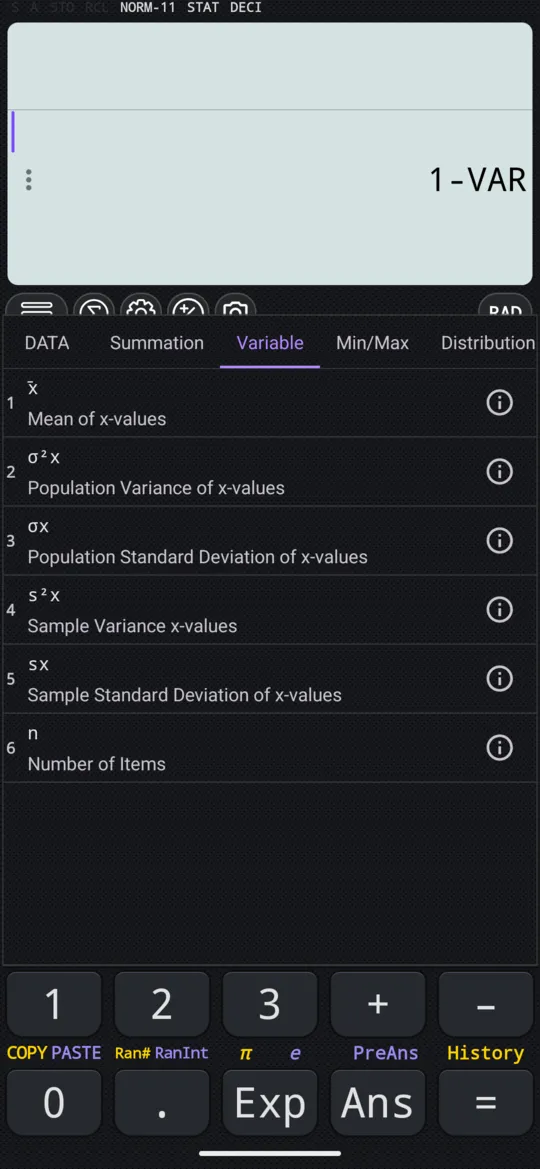
The statistics are spread over three tabs of the STAT menu:
| Tab | Single-variable | Paired data adds |
|---|---|---|
| Summation | ∑x, ∑x², ∑x³, ∑x⁴ | ∑y, ∑y², ∑xy, ∑x²y |
| Variable | x̄, σ²x, σx, s²x, sx, n | ȳ, σ²y, σy, s²y, sy |
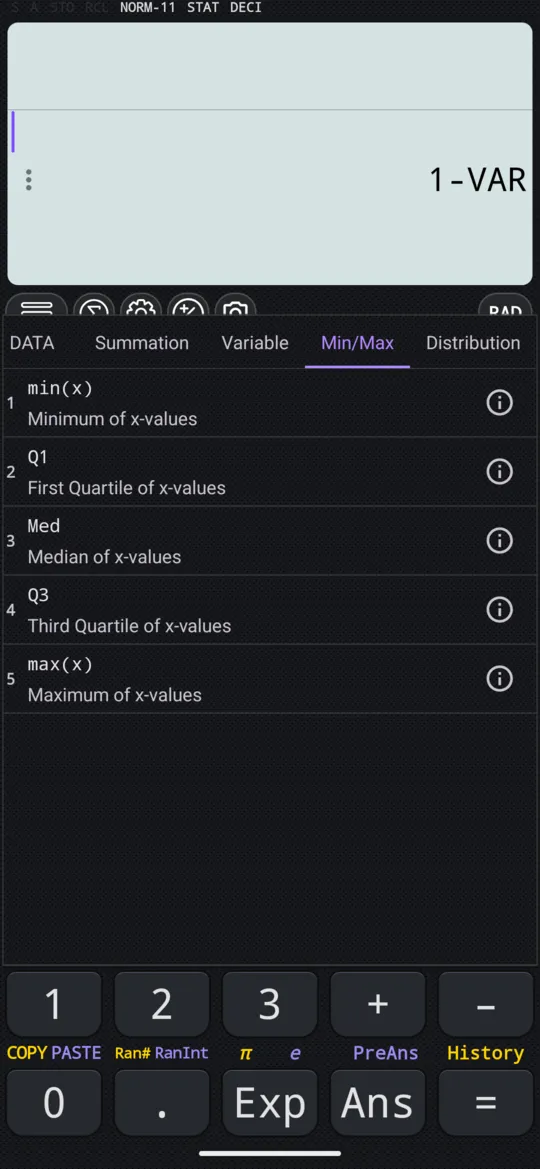
| Min/Max | min(x), Q1, Med, Q3, max(x) | min(y), max(y) |
The median and the quartiles
Med is the median, and Q1 and Q3 are the lower and upper quartiles. On their own they are on the Min/Max tab, between min(x) and max(x), so the five-number summary reads in order down the tab.
Paired data
With a paired type selected (one of the seven regression types on the DATA tab, such as A+BX), the DATA tab offers 2-variable calculation instead, and the screen lists twenty-three values. The quartiles are dropped, and the statistics of y, the sums ∑xy and ∑x²y, and ∑x³ and ∑x⁴ take their place. For the pairs (170, 66), (173, 68) and (179, 75):
in 2-VAR
out x̄ = 174, ∑x = 522, ∑x² = 90870, σ²x = 14, σx = 3.74165738677, s²x = 21, sx = 4.58257569496, n = 3, ȳ = 69.66666666667, ∑y = 209, ∑y² = 14605, σ²y = 14.88888888889, σy = 3.85861230093, s²y = 22.33333333333, sy = 4.72581562625, ∑xy = 36409, ∑x³ = 15826056, ∑x²y = 6345647, ∑x⁴ = 2757580722, min(x) = 170, max(x) = 179, min(y) = 66, max(y) = 75
Here σ²x is 14 and s²x is 21: with only three values, dividing by n − 1 instead of n makes a large difference. Regression and correlation fits a straight line to these points.
At a glance
| To get | Choose |
|---|---|
| The thirteen statistics at once | SHIFT 1 STAT, DATA, 1-variable calculation |
| The mean | Variable tab, x̄ |
| The standard deviation | Variable tab, σx (population) or sx (sample) |
| The variance | Variable tab, σ²x or s²x |
| The count | Variable tab, n |
| The median and quartiles | Min/Max tab, Med, Q1, Q3 |
| The sums | Summation tab |
Questions
How do I find the mean and standard deviation of a list of numbers?
Press MODE and choose STAT/DISTR, choose 1-VAR on the DATA tab of SHIFT 1 (STAT), and type the numbers down the x column, pressing = after each. Then press SHIFT 1 (STAT) again and choose 1-variable calculation on the DATA tab. x̄ is the mean, σx the population standard deviation and sx the sample standard deviation. For 1, 2, 2, 3, 3, 3, 4, 4, 5 they are 3, 1.15470053838 and 1.22474487139.
What is the difference between σx and sx?
σx is the population standard deviation and sx the sample standard deviation. Their squares, the variances σ²x and s²x, divide by n and by n − 1 respectively, so sx comes out larger, most of all when there are few values. Use sx when your numbers are a sample drawn from a bigger group, and σx when they are the whole group.
How do I find the median and the quartiles?
They are on the same screen as the mean: Med is the median, Q1 and Q3 the lower and upper quartiles, with min(x) and max(x) completing the five-number summary. On their own they are on the Min/Max tab of the STAT menu. They describe single-variable data, so read them with 1-VAR selected.
Why is n bigger than the number of rows?
Because n is the total of the Frequency column, not the number of rows. The nine values 1, 2, 2, 3, 3, 3, 4, 4, 5 entered as five rows with their frequencies give n = 9. With the Frequency column turned off, every row counts once.
Related pages
- Entering data in STAT mode the editor, the Frequency column, inserting and deleting rows
- Z-scores from your data the standard score of a data value, and the areas P, Q and R
- Regression the line of best fit, the six curves, r, ŷ and x̂
- Statistics and probability which tool for which job, and what each page of the chapter covers
Written from the calculator's own manual and from the app itself, version 7.6.0; every figure is one the manual shows or a capture of the app proves. Last revised on 29 September 2026.
Bug reports and feature requests go to kimcuc@samatica.com — a person reads it.